
Report Status
INTRO
The goal of this excel template it all about tracking orders or projects and Keep all the team in the loop. Easier to work with, it can provide visibility for all the stages from incoming orders, inventory control, internal flow and its conclusion. It is already being used by some small companies.
I create all the data based on a shoe company and consequently orders for instance. The features are endless… also customizable to accommodate your workflow needs! Let´s start.
1.SETTINGS. The template has only 2 visible sheets and I suggest creating another one with some pivot tables to provide extra info. In the “Source” sheet you can find the linkage to textboxes, presented in the other page, you can simply hide it. In the “Status” sheet the only fields must be respected it’s the “SECTOR 1”, “SECTOR 2” to “SECTOR 6” because the function work with a word and a number (for example: … CORRESP (“SECTOR “&N_ST&”” …). You just can rename the word SECTOR, after this you must go to the columns “STAGE” and “VALIDATION” and replace, in the function field, the word you have chosen.
2.DIVISIONS (STATUS sheet fields).
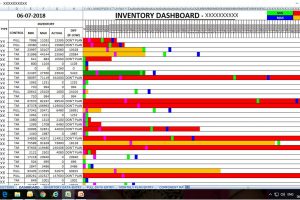
A) In the top you can find 4 textboxes act as a rapid alarm about what goes around. The first one is about the order intake and its conclusion (below: dynamic chart). The second manage the inventory control alert, for example, in red which has not any purchase order created, in orange we are waiting and finally in green, the p.o. arrived and create stock. Third, for the higher priority deadlines. Fourth, it’s the sum of the flow in the all stages. Fifth, show the errors between the columns “SECTOR 1” to “SECTOR 6”.
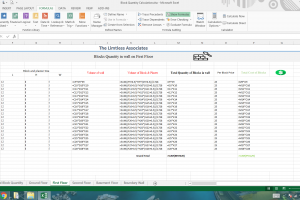
B) Columns “ORDER” to “LAST” describe all the order data.
C) Columns “LEATHER” to “SHIP BOXES” manage the inventory control with 3 colours. In the waiting process you can write the date when the goods will arrive or simply just the colour. The conditional formatting gives the cells colour, you are able also to custom it. By default, they come in red and when you type C or some date becomes orange, D for delivered. Column “DELIVERED” show the percentage complete, from 0 to 100%. Column “MAX DATE” is the later date of supply. Once we have achieved 100%, all goods in the warehouse, we could start work with the order.
D) Columns “START” to “DURATION” demonstrate the tracking and time. This is applicable for scenarios where the stages are pre-set in sequence. We work with the date of conclusion. For example, once SUPPLY is completed, CUT begins and so on until the last sector. Once the orders have been completed, the word complete appear in the “STAGE” column. This are great to calculate effectiveness.
E) Column “VALIDATION” confirm if all the dates were properly introduced. An optional extra, for example, you can work with partial deliveries and as soon as it is finished just type the date.
Reviews
Only logged in customers who have purchased this product may leave a review.


There are no reviews yet.