
Purchasing Managers Index – Economy indicators
Welcome to this excel!
This tool is one to check the Real GDP (inflation adjusted GDP)compared to two of the most powerful leading indicators of the economy.
The PMI (Purchasing managers index) shows the state of economic growth. Reflecting either contraction or expansion, the PMI is a survey closely watched by traders of all types: scalpers, swing, or investors. The survey refers to private sector companies and takes place monthly. No less than four hundred purchasing managers are asked to rate the company’s situation, and evolution in specific areas, such as new orders, employment, inventories, supplier delivers and orders backlogs.
Managers have three options to rate all those categories: better conditions, similar to last month, or worse conditions for the company.
Then, the answers are compiled in one single release, called the PMI, that comes out monthly. The result revolves around the fifty (50) level and shows potential economic contraction or expansion.
More precisely, when the PMI dips below the fifty level, the economy enters the recessionary territory. On the move above fifty, it expands.
Therefore, the job of news traders and not only is to react to changes in the PMI releases and buy or sell the currency accordingly.
PMI releases come out in two distinct parts: one for the manufacturing (simply known as PMI) and one for the non-manufacturing, services sector (known as NMI).
In the United States, the numbers are calculated by the ISM (Institute for Supply Management) and it is released at the beginning of each month, for the previous month.
PMI data has been available since 1950, while NMI has been available since 1997.
I have already added all the available data, since 1950’, so all you’ll have to do is add the newly released data so you can have an up to date indicators tool.
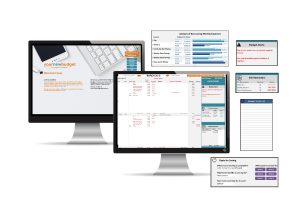
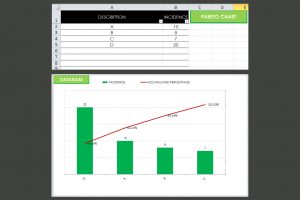
For that, enter the corresponding sheet (DATA PMI and DATA NMI), go to the Quarter column, select the filter and check the blanks (as you can see in the screenshots). This way you’ll open all the months that make up each quarter. At the end of the sheet, add the newly released values to the corresponding months. Also add the new Real GDP figures (both value and change) to the corresponding quarters and years and the tool will automatically create a chart for you.
Use this wisely and please contact me at ady.rotaru3006@gmail.com if you need assistance.
Reviews
Only logged in customers who have purchased this product may leave a review.
There are no reviews yet.